


Digital Gold vs Physical Gold: Where Should You Invest in 2025?
🧭 Introduction Investing in gold in 2025 is no longer a straightforward decision between purchasing a gold coin and keeping ...
At GlobalInfoVeda.com, “Data Explainer” is dedicated to making complex information easy to understand. In today’s data-driven world, numbers, charts, and reports can feel overwhelming. This space breaks them down into clear, accessible insights that help readers connect facts with real-world meaning.
We cover a wide range of topics, from economics and technology to health, education, and public policy. Using simple language, visuals, and examples, each explainer transforms raw data into stories that highlight patterns, trends, and key takeaways. Readers gain the ability to interpret statistics, understand research findings, and apply this knowledge in practical ways.
This section also emphasizes data literacy—helping individuals question sources, verify accuracy, and avoid misinformation. By exploring how data is collected, presented, and used in decision-making, we empower readers to think critically and make informed choices.
Real-world case studies and infographics make complex subjects relatable, whether it’s understanding GDP growth, climate change impacts, healthcare trends, or digital adoption rates. The goal is not just to present data, but to explain the bigger picture it represents.
Explore “Data Explainer” at GlobalInfoVeda.com to gain clarity, confidence, and perspective in a world shaped by information and analytics.
🧭 Introduction Investing in gold in 2025 is no longer a straightforward decision between purchasing a gold coin and keeping ...

💳 Introduction Credit bureaus in India are quietly and significantly being updated in 2025 as rent payments and UPI activity ...
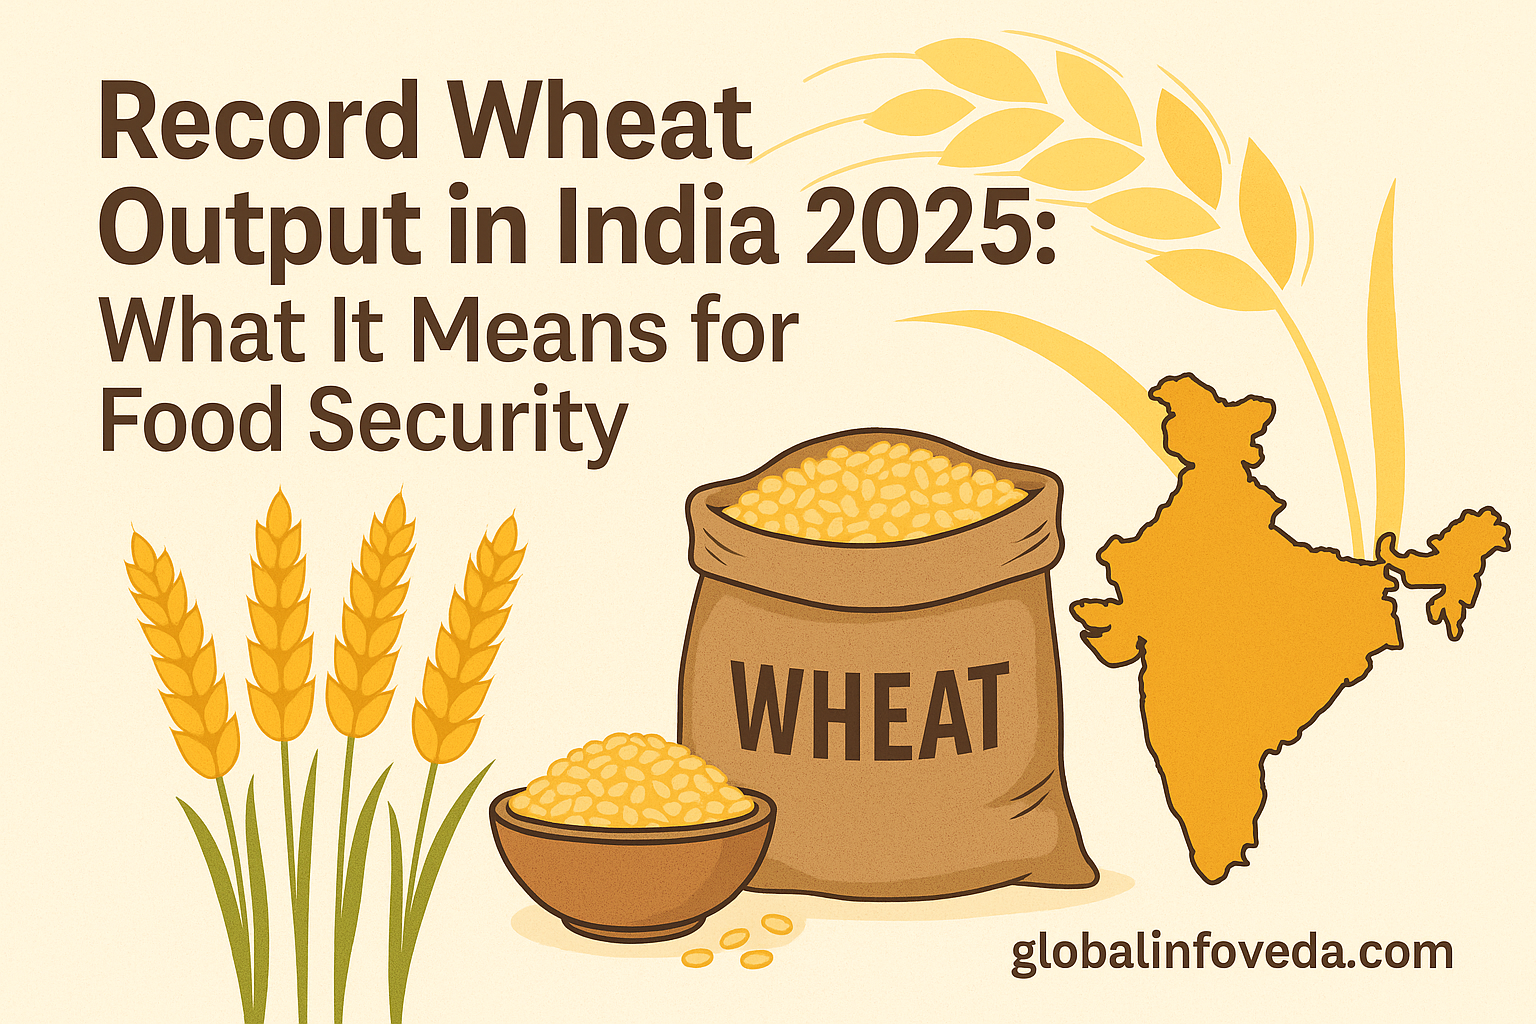
🌾 Introduction Record wheat output — 2025 has, in a way, become the word on every policy brief and mandi ...
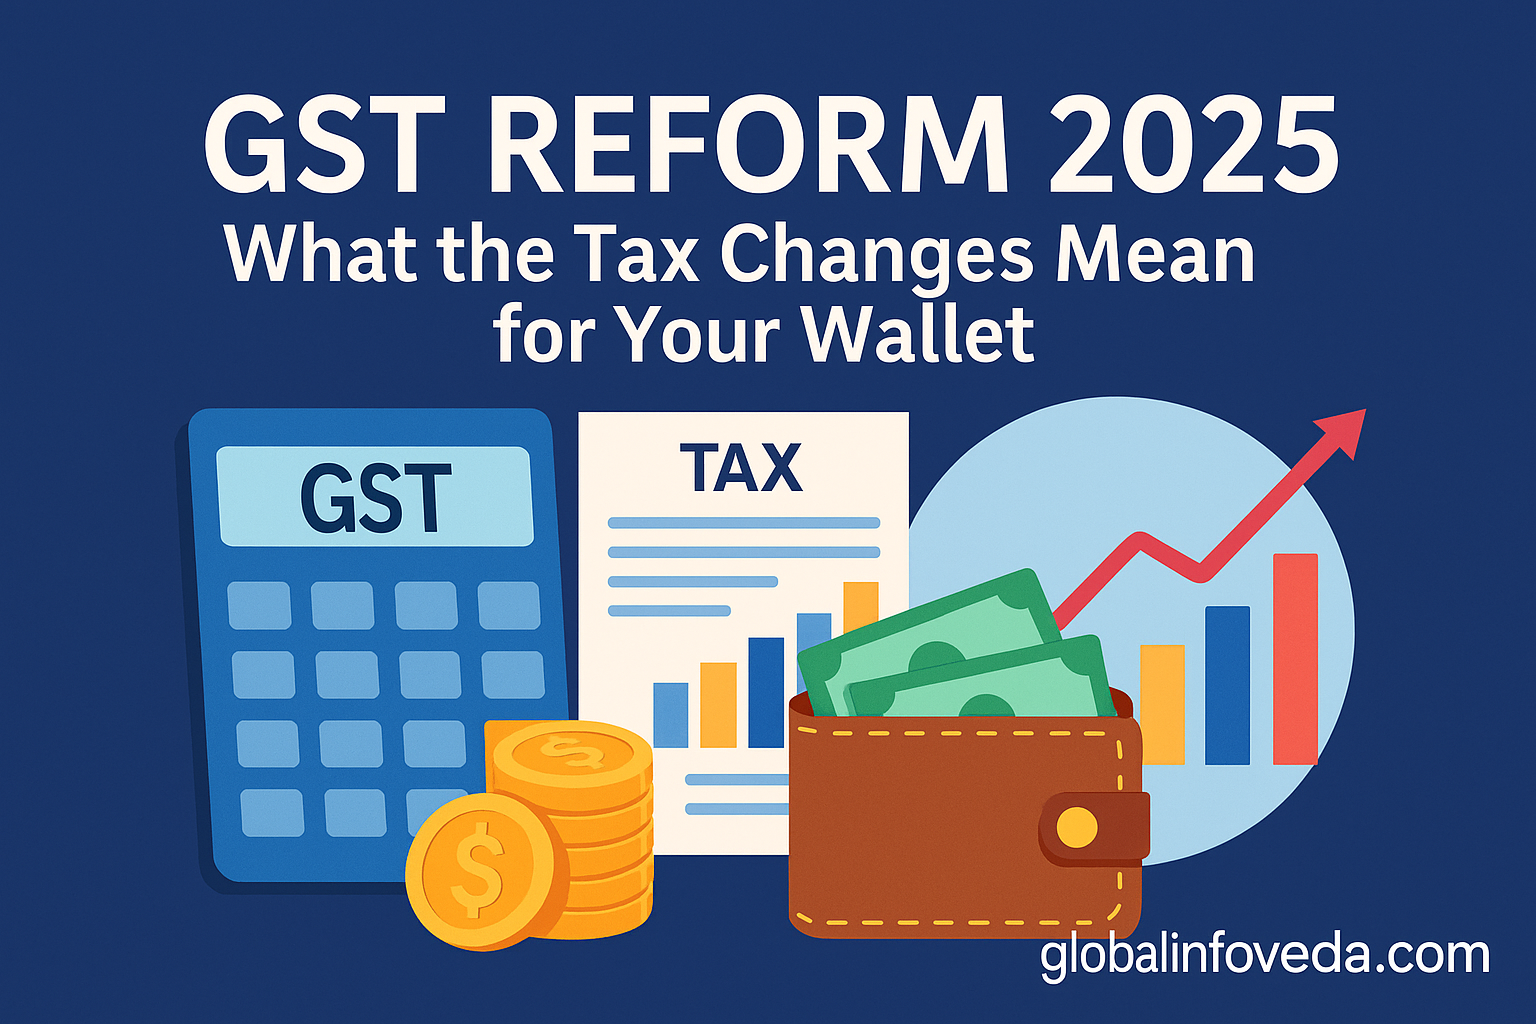
🧾 Introduction GST reform 2025 is the most significant reset to India’s indirect tax since launch, and it impacts your ...
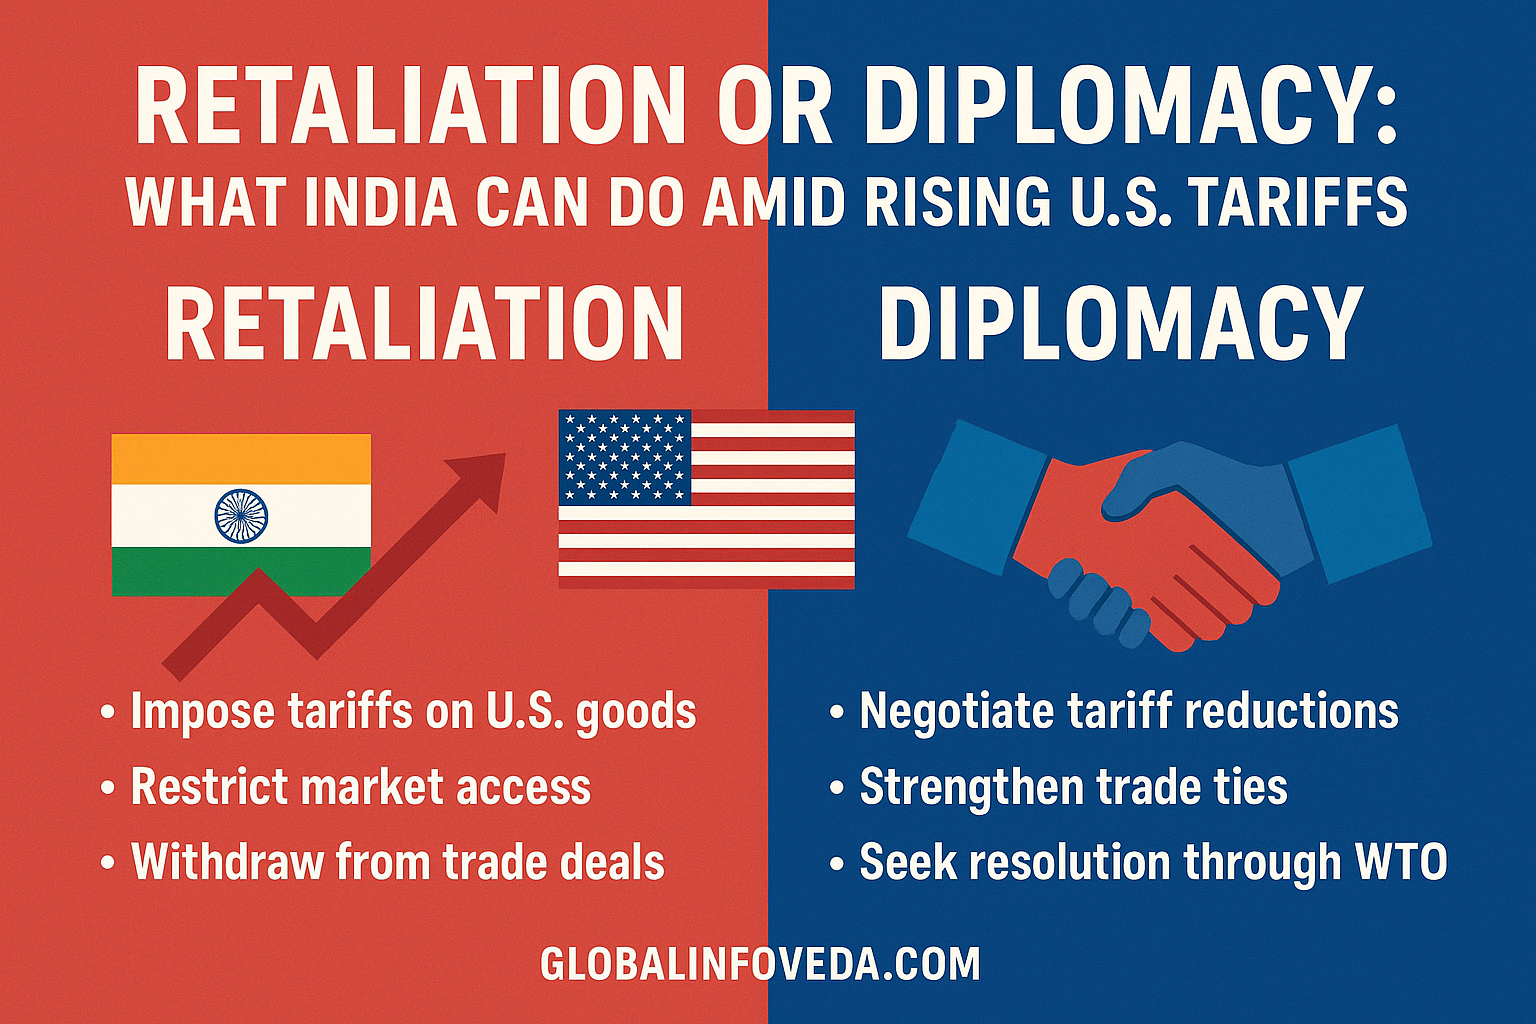
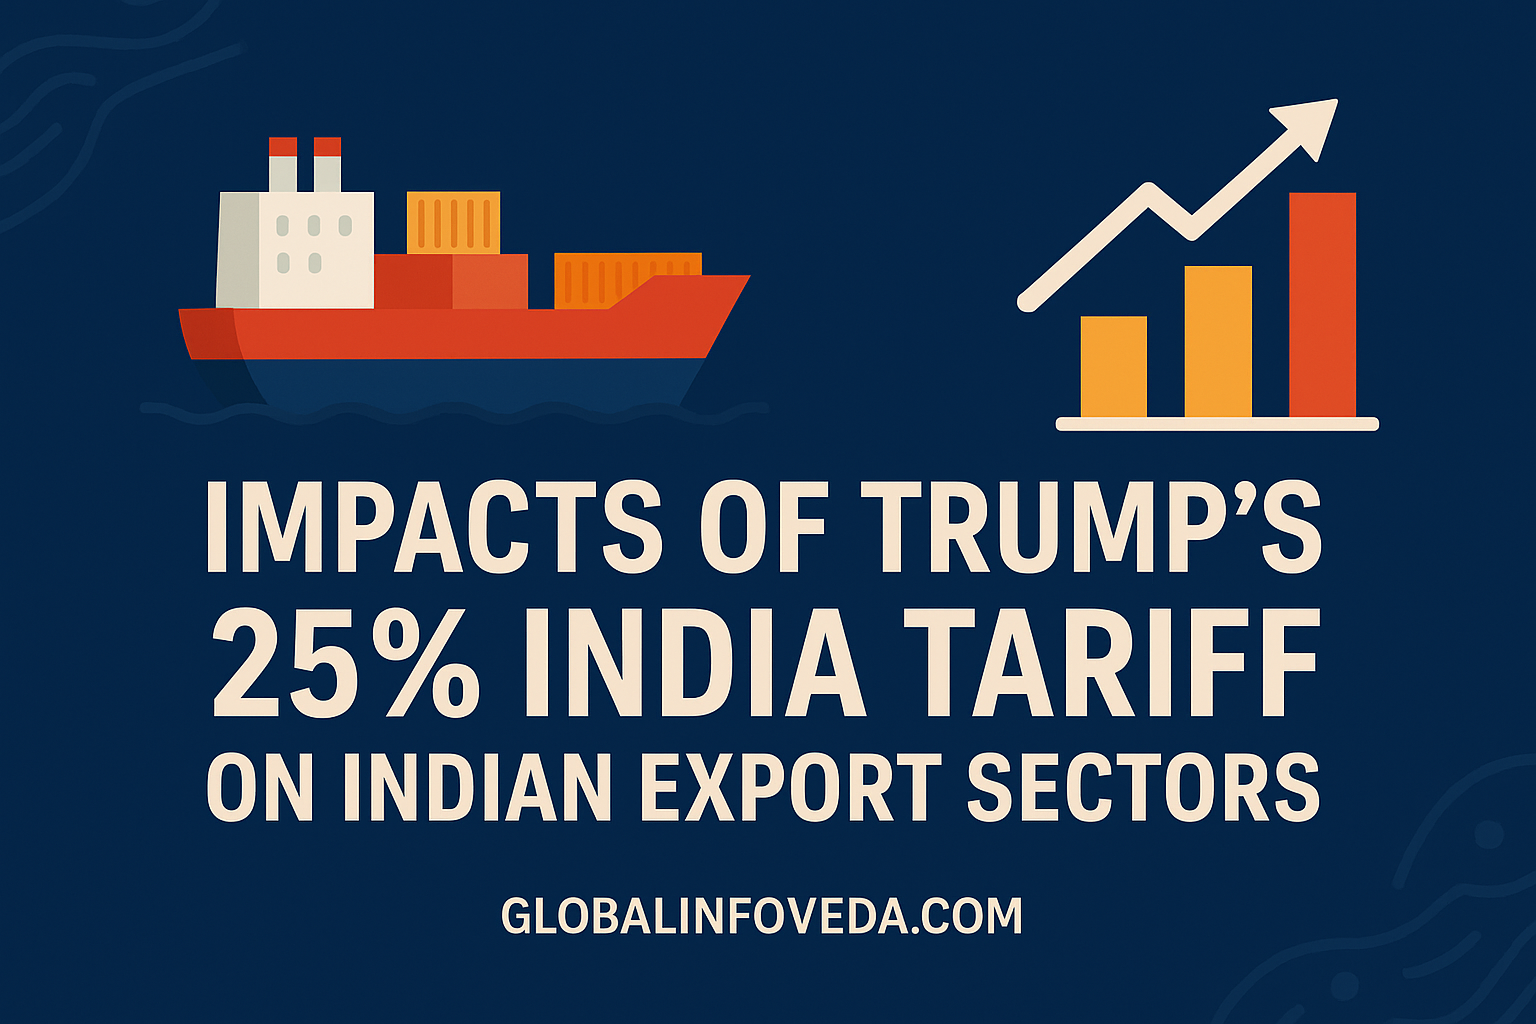
⚖️ Introduction So-called “Liberation Day” tariffs— the headline 25% duty layer slapped on India‑origin imports far and wide—have set off ...
📈 Introduction Tariff shocks seldom limit themselves to trade ministries. The rupee probes into new zones, investing sentiments shift from ...
🌏 Introduction The 25% U.S. tariff shock that sent effective duties to ~50% on many HS lines has compelled India’s ...
🌏 Introduction Why did the US declare a 25% “new” tariff for India-origin goods in 2025 — and why did ...